Determinants of Animal Protection Policy
A Cross-Country Empirical Study
Alexander Holst & Pim Martens
This study aims to identify determinants of animal protection policies. Based on a review of relevant literature and borrowing concepts from environmental policy research, we suggest three broad factors to be positively related with stricter animal protection policies: economic development, democracy, and civil society. To test the influences of these factors, we estimate an ordered logistic regression model to explain policy variations between 48 countries. As dependent variable we use the Animal Protection Index, a country ranking based on policy strictness. As independent variables we use GDP per capita, Polity Score, Civic Activism Index, and number of animal protection organizations. Results suggest that countries with stronger democratic institutions and more civil society groups focused on animal protection are likely to have stricter animal protection policies. For economic development and broad civil society strength we do not find significant effects. Our analysis broadens the basis for future research of more detailed policy determinants and cross-country differences in animal protection.
Determinants of Animal Protection Policy: A Cross-Country Empirical Study
Humans use animals for a wide variety of purposes, including food production, scientific experiments, companionship, and entertainment. The vast majority of those domesticated animals live on farms. In 2010, about 33 billion mammals and birds were used in the agricultural sector world-wide (FAO, 2013). There is no reliable estimate for fish used in aquaculture. It is estimated that at least 115 million animals are used annually for research purposes (Taylor, Gordon, Langley, & Higgins, 2008). An unaccounted-for number of animals are directly dependent on humans in private homes, zoos, and circuses. In addition, wild animals in natural habitats are profoundly influenced by human activities, like hunting or habitat destruction through land use change and pollution.
Concerns for animal well-being are partially grounded in an acknowledgement that animals of some species are sentient and even have higher cognitive capacity similar to humans. In the past decades that acknowledgement has been substantiated by evidence from multiple scientific disciplines such as zoology, psychology, and neuroscience (Jones, 2013). The precise demarcation line for various complex cognitive capacities is a matter of ongoing scientific debate, but it is widely recognized that all mammals and birds have the capacity to feel pain, fear, and distress. Today, often all vertebrate species, including amphibians and reptiles, are considered to be sentient (Proctor, 2012). A smaller number of animal species are considered to possess higher cognitive capacities like self-awareness. For example, common chimpanzees are able to recognize themselves in a mirror (Gallup, 1970), an ability most animal species seem to lack. Animal sentience has played a crucial role in different arguments in favor of better treatment of animals for their own sake, most prominently by Singer (1975) and Regan (1983). Without revisiting the arguments made in these and subsequent works, their common basis is the acknowledgement that many animals are sentient beings, and that they ought to be included in ethical and political considerations by virtue of being able to feel pain and discomfort.
Animal suffering has been linked to harm for humans. Intensive animal farming practices, such as high dosage of hormones and antibiotics used for beef production and agrochemicals used in feed production, have been found to pose a threat to human health (Chemnitz & Becheva, 2014). Animal agriculture also causes environmental degradation: for instance, emissions of methane and ammonia from livestock production contribute to global climate change (Gill, Smith, & Wilkinson, 2010).
Whether animal well-being is increased for human benefits or for the sake of animals themselves, several countries around the world have adopted policies to protect animals. Animal protection can be an issue for multiple policy sectors and thus be treated by different governmental departments, e.g. farm animals and fish fall within agriculture and fishery policy, wild animals within environmental policy, and animals used for scientific experiments within research policy.
Modern animal protection policies have emerged with the establishment of anti-cruelty laws in the UK during the first half of the 19th century. Since then, legislation to protect animals has been enacted in most countries in Europe and North America, and some countries in other parts of the world. However, animal protection policies vary both with regard to their strictness, and the number of animals they cover. Policies range from anti-cruelty statutes, to banning of specific husbandry methods, and standards of conduct for breeding, husbandry, and slaughter.
Since the second half of the 20th century, animal protection rules have been included in international agreements, such as the World Organization for Animal Health (OIE), which is recognized as a reference organization of the World Trade Organization (WTO) and had 180 member states in 2014. In Europe, binding animal protection rules for certain farm animals have been enacted both by the Council of Europe and the European Union. Despite efforts to establish international rules for animal protection, considerable differences across countries and world regions remain.
Determinants of Animal Protection Policy
In the context of animal protection, factors suggested to influence policy are mostly supported by anecdotal evidence. Few studies have attempted to systematically explore such determining factors. In this section we briefly review those factors.
Economic Development. There has been some research done to explain variations between countries' level of animal well-being by economic differences (Frank, 2008; Lombardini, Kosenius, Kulmala, & Lindroos, 2011). These studies attempt to explain differences in animal well-being, or welfare, not animal protection policies. Many of these studies draw from theoretical concepts about the relationship between environmental performance and economic growth, most notably the concept of the Kuznets Curve (Kuznets, 1955). Kuznets (1955) first proposed an inverse U-shaped curve to describe the relationship between economic development and income inequality. His suggestion was that in a country's early stages of development, income inequality increases with economic growth until a tipping point is reached, after which further growth is accompanied by decreasing inequality.
The same relationship has been suggested to exist between economic growth and environmental performance. The Environmental Kuznets Curve (EKC) represents an inverse U-shaped relationship between environmental degradation and economic growth (see Figure 1): Economic growth in early development stages leads to higher levels of environmental degradation until it reaches a peak, after which environmental degradation decreases.

Since the early 1990s there have been a large number of empirical studies testing if the EKC hypothesis holds in reality, with mixed results largely depending on what precise indicator is chosen for environmental degradation. For a review and critical analysis of the EKC literature see Caviglia-Harris, Chambers, and Kahn (2009) and Stern (2004).
Drawing on this research on the EKC, Frank (2008) explores the existence of an Animal Welfare Kuznets Curve (AWKC). To keep in line with Kuznets' original negative formulation—inequality instead of equality—the inverse U-shaped relationship hypothesized by the AWKC is between economic growth and animal harm. Initial economic growth would increase animal harm until a point is reached after which animal harm levels decrease.
To test the AWKC, Frank (2008) looks at various indicators for animal well-being, but most of them reflect the numbers of animals used for purposes harmful to animals, such as meat production or laboratory research. Frank (2008) concludes that his empirical findings regarding the existence of an AWKC are mixed, with evidence for its existence being strongest for companion animals. However, only data from the US is used to test the AWKC for companion animals. Frank (2008) states that if public concern is the major driver for decreasing animal harm, then the observed decrease in harm levels of companion animals compared to other animals could be explained by stronger public concern for them, maybe due to the emotional bond between companion animals and their owners. He did not find similarly decreasing levels of harm for farm animals.
Lombardini et al. (2011), aiming to test the AWKC for farm animals in Finland, come to a similar conclusion. They did not find a decrease or absolute maximum in the annual number of farm animals slaughtered from 1975 to 2008, a period during which Finland's GDP per capita roughly doubled.
Morris (2013) acknowledges the mixed evidence for the AWKC found by Frank (2008) and the mixed results for the EKC. Drawing on research on animal well-being in New Zealand and research linking human social welfare and environmental protection to greater income equality, Morris (2013) explores if a similar link exists for animal well-being and income equality. Correlating different indicators for animal well-being and income equality, he finds a positive relationship between animal well-being and income equality. But absent a method to establish a causal link, Morris (2013) acknowledges that his finding could plausibly be reflecting that societies that promote income distribution may also generally be fairer societies that also promote better treatment of animals.
In the same study, Morris (2013) also considers differences in animal protection policies across 22 high-income countries. As an indicator of animal protection policy strictness, countries are scored points based on existing bans or phase-outs of certain husbandry and production practices considered particularly harmful to animals. This protective regulation score was found to be positively correlated to higher equality levels, indicated by lower Gini coefficients. However, with more comprehensive scoring of state-level legislation in the US, this relationship between protective regulation and income equality could not be found.
Democracy. We suggest democracy as a second factor influencing animal protection policies. We hypothesize that more democratic countries have stricter policies to protect animals. While there are no notable studies on the effect of democracy on animal protection, the relationship between democracy and environmental protection has been subject of several studies.
In their analysis of the effects that different levels of democracy have on environmental degradation, Li and Reuveny (2006) find a consistent effect: Higher levels of democracy lead to less environmental degradation, even when controlling for several variables which have been suggested to also influence environmental performance, such as income per capita and population density. Fiorino (2011) reviews the political science literature on the relationship between environmental performance and democracy, stating:
It does seem reasonable to conclude that—broadly speaking—democracies are more capable of responding to environmental issues and managing them effectively than autocratic regimes. [...] To the extent that they promote political stability, responsive institutions, the rule of law, and other aspects of strong governance, democracies may be in a better position to deliver environmental quality to their citizens. (Fiorino, 2011, p. 377)
Frank (2008) suggests that public concern for animals is linked to the activity of animal protection organizations which in turn influences policy. He suggests that public concern for both animals and the environment is driven by altruistic attitudes. More specifically, if animals are seen as part of the natural environment, concern for their well-being might increase when concern for the natural environment increases. Reviewing multiple surveys of altruistic values and attitudes towards the environment, Dietz, Fitzgerald, and Shwom (2005) find that people with strong concern for non-human animals also have a strong concern for the natural environment. Following Fiorino (2011) in his assessment of the association between regime-type and environmental protection policy, we similarly expect that democratic countries have stronger animal protection policies, because they tend to offer better opportunities for political mobilization, are more responsive to their citizens, and exhibit stronger rule of law.
Civil Society and Animal Protection Organizations. Rowan and Bosen (2005) track changes in animal protection rules in US federal and state level legislation between 1950 and 2003 and link them to the evolution of the animal protection movement. They note that US non-governmental animal protection organizations, as part of the broader social movement, have invested considerable resources into lobbying for changes in legislation toward animal protection. Increased frequency of state referendums initiated by animal protection organizations is attributed to growing political clout and media exposure of the animal protection movement. Fraser (2008) makes a similar observation for protection of farm animals, noting that animal protection organizations have played a key role in drawing public attention, encouraging reform, and funding research and action on the issue. This could suggest that differences in animal protection policy strictness between industrial and developing countries may be the result of the latter lacking a well-developed animal protection movement (Fraser, 2008).
In the context of classifying differences in animal protection policies across countries, Irwin (2003) notes that in industrial and developing countries different issues are dominating in civil society. Whereas in industrial countries issues concerning companion animals drive the activity of many animal protection organizations, in developing countries wildlife and farm animal issues are more salient.
One study comparing animal protection legislation in Latin America, Asia, and Africa concludes that while increased presence of animal protection organizations in those regions can help to raise issue awareness, socio-economic and cultural factors also play a major role in introducing and enforcing animal protection legislation (Trent, Edwards, Felt, & O'Meara, 2005).
It should be noted that of the five studies analyzing animal protection legislation and civil society influence referenced above, all authors are affiliated with the Humane Society International or the Humane Society of the United States, one of the largest animal protection organizations, and their studies are published by the Human Society Press. This is not to say that their findings are not credible. Rather, it is indicative of how little research has been done on these issues at universities and independent research institutes.
As we have seen, academic research on factors influencing animal protection policies falls roughly in two categories. One explores the linkage between economic development, animal well-being, and animal protection. The other explores the influence of civil society, and more specifically animal protection organizations, on animal protection legislation.
While the results of studies on the relationship between economic development, animal well-being (Frank, 2008; Lombardini et al., 2011), and animal protection policy (Morris, 2013) seem mixed, we assume an overall positive relationship between economic development and animal protection policy to be tested in our subsequent analysis. Thus, our first hypothesis:
H1: Countries with higher levels of economic development have stronger animal protection policies in place.
Following Fiorino (2011) in his assessment of regime-type influencing environmental protection policy, we expect similarly that democratic countries have stronger animal protection policies, because they tend to offer better opportunities for political mobilization, are more responsive to their citizens, and exhibit stronger rule of law. This leads us to our second hypothesis:
H2: Countries with higher levels of democracy have stronger animal protection policies in place.
With regard to the role of civil society and NGOs, research on animal protection policy (Fraser, 2008; Rowan & Rosen, 2005; Trent et al., 2005) suggests that increased civil society strength and NGO involvement lead to stricter policy outputs. This leads us to our third hypothesis:
H3: Countries with stronger civil society have stronger animal protection policies in place.
We hypothesize that all three factors together— economic development, level of democracy, civil society—determine a country's animal protection policy to a large degree. Table 1 gives an overview on the data used for our statistical analysis, which will be explained below.
|
Table 1. Details of data used |
|||
|
Variables |
Data type |
Explanation |
Source |
|
API |
ordinal |
Animal Protection Index, reflecting the extent to which countries' policies protect animals |
WAP (2014) |
|
GDP |
continuous |
GDP per capita, 2013 PPP in 1,000 USD |
IMF (2014) |
|
PLT |
ordinal |
Polity Score, composite index of countries' democratic and autocratic institutional characteristics |
Marshall
and |
|
CIV |
ordinal |
Civic Activism Index, based on countries' civil society characteristics and surveys of public political participation |
ISD (2013) |
|
APO |
continuous |
Animal protection organizations per 10,000 km2 |
WorldAnimalNet
|
For our dependent variable we use the Animal Protection Index (API), published for the first time in 2014 by World Animal Protection, a civil society group (WAP, 2014). API is a composite index aiming to reflect to what extent a country's policies and legislation offer protection for animals and improve their welfare. Countries are qualitatively assessed by experts based on fifteen indicators grouped into five themes. Countries are scored for each indicator and overall within seven bands from A to G, with A representing the highest and G the lowest level of protection. While scores for each indicator are published, no detailed information on how the overall scores are calculated, e.g. averaging indicator scores, is given.
Both the presence of specific animal protection policies and legislation as well as the structure of enforcement mechanisms are assessed. Also included are barriers toward effective animal protection such as cultural customs regarding animals, and regulatory traditions. As such, API reflects countries' policies, regulations, and customs with regard to animal protection. API does not reflect what the actual outcomes with regard to animal well-being of those policies are. This is appropriate for our goal to investigate the determinants of policy, since outcome may be influenced by factors that are not connected to policy making. Furthermore, using outcomes as proxy for policy neglects potential time lags between a policy action and its impact.
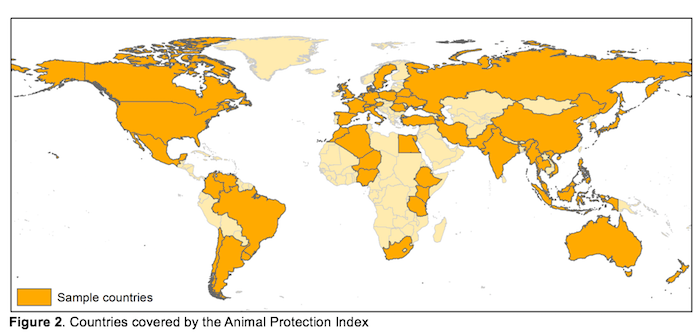
The API covers 50 countries (see Figure 2). Countries are selected from the largest producers of meat, eggs, and dairy products. Possibly, this is done to account for countries where the largest numbers of animals are used by humans, indicating relevance for animal protection. However, this criterion is likely to disproportionately exclude least developed countries and countries with small populations where animal-based production volumes are low.
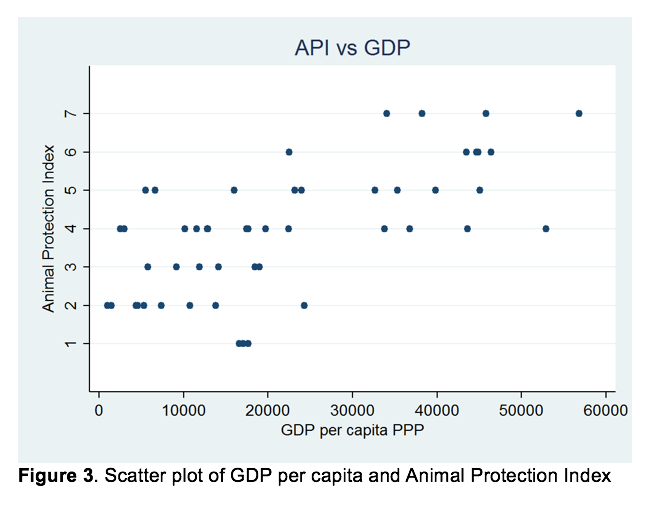
As a measure of economic development we use GDP per capita based on purchasing power parity (PPP) in 2013 from the International Monetary Fund (IMF, 2014). GDP per capita captures the monetary value of all goods produced and services provided in a country divided by its population. A scatter plot between GDP per capita and API is shown in Figure 3. The first visual impression is in line with a positive relationship between the two variables.
However, there are considerable shortcomings of GDP as a measure of economic development. For one, GDP measures all economic output equally, irrespective of the purpose, quality of the goods produced, or services provided. GDP counts any monetized activity, even activity that is destructive to public health, like cigarettes, or to the environment, like clearing rainforest. Also, GDP does not take non-monetized economic activity into account, such as volunteer services or family child-care. And of course GDP does not give any indication of economic inequality or the composition of an economy.
But while there are considerable shortcomings with GDP as a measure of economic performance, let alone of social well-being, it is still useful. For all practical purposes, GDP data is available for nearly every country and its measurement method is relatively consistent. Additionally, its narrow scope can actually be beneficial if researchers want to disentangle effects of different economic factors.
As a measure of regime type we use the Polity Score from the Polity IV Project (Marshall & Jaggers, 2014). It ranges from -10 (full autocracy) to +10 (full democracy). The Polity Score is based on expert judgments about countries' levels of institutionalized autocracy and democracy. Criteria for the scoring include competitiveness of political participation, selection of the political executive, and constraints to executive authority. We should note that each country is initially separately scored for autocratic and democratic characteristics and given both an Autocracy Score and Democracy Score each between 0 and 10. The combined Polity Score is calculated by subtracting the Autocracy Score from the Democracy Score, thus gaining a single value between -10 and 10. This means that the same Polity Score can be reached by different combinations of autocratic and democratic characteristics.

Our selected group of countries leans heavily towards the democratic side of the spectrum (see Figure 4). Thirty-three countries are mostly democratic, defined by some authors (Fearon & Laitin, 2003; Li & Reuveny, 2006) as having a Polity Score of six or above. In contrast, only five of our countries are mostly autocratic, defined as having a Polity Score of -6 or below. The median score is 9. However, the distribution of the full Polity Score dataset, which covers 166 countries, is also skewed towards the democratic end of the spectrum, although, with a median score of 7, less so than our group of countries.
To reflect how active and engaged civil society is on a broad level, we use the Civic Activism index from the Indices of Social Development Database (ISD, 2013). This composite index combines measures of size and activity of the NGO sector with survey results about coverage and use of news media, and reported willingness to participate in different forms of political protest (e.g. demonstrations, petitions). The composite index is scaled between 0 and 1. Figure 5 shows a scatter plot of the Civil Activism Index and API. For convenience, we multiply each value of the Civil Activism index by 100. When discussing our analysis results in the next section, this will make the interpretations of the results more intuitive.

Animal Protection Organizations per area
While the Civic Activism Index is useful as a broad indication of civil society activity, it does not distinguish between different policy sectors. A country may have a vibrant civil society overall, but next to no civic engagement on the topic of animal protection.
To account for more narrow civil society with regard to animal protection we use the number of animal protection organizations as registered in the WorldAnimalNet Directory (WorldAnimalNet, 2015). The directory lists offices of animal protection organizations by country. Any NGO can be included as long as its work is directly related to animal protection. Over 17,000 organizations in over 130 countries are listed.
However, comparing the total numbers across countries can be problematic due to the counting method. Initially, the directory was created to provide a resource for activists and citizens to look up where the nearest animal protection organization is located. For that purpose, different office locations of the same organization are counted separately and figure into the total numbers per country. This poses a challenge for comparing the numbers across countries. For one, in countries with a larger geographic area, like Canada or Australia, organizations are more likely to have more office locations, everything else being equal. For organizations providing animal shelters, for example, it is plausible that they may maintain multiple locations in order to provide their services in different cities and regions. To account for differences between country areas we use the number of animal protection organizations per country area.
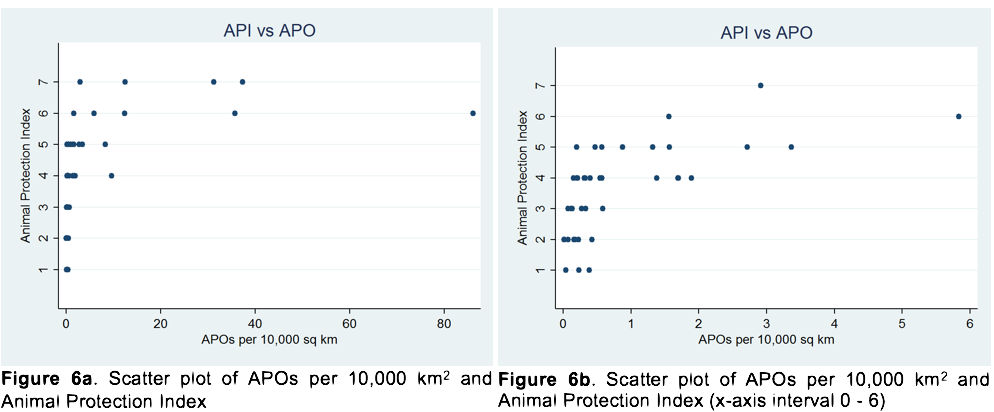
A scatter plot (Figure 6a) of API and animal protection organization (APOs) per 10,000 km2 shows that in a few countries there are many more organizations per area than in most others in our group of countries. The Netherlands (86) have by far the most organizations per 10,000 km2. UK (37), Germany (35), and Switzerland (31) follow. The initial visual impression suggests a non-linear relationship, possibly better described with a logarithmic function. However, this impression could be caused by the few countries with high APO per area count. But even when neglecting the large APOs per area values and zooming into the lower values, the visual impression does not change fundamentally (see Figure 6b).
Conceptually, this relationship could reflect a diminishing
marginal impact animal protection organizations have on policy outputs. It
seems plausible that in a country with very low APO activity, an additional
organization can have a strong impact on policy, e.g. by increasing awareness
about the issue of animal protection among largely oblivious officials and the
public. In contrast, in a country with already high APO activity, an additional
organization conceivably has much less of an impact since issue salience is
high to begin with. For our analysis in the next section, we will log-transform
the number of animal protection organizations per area to the base of two and
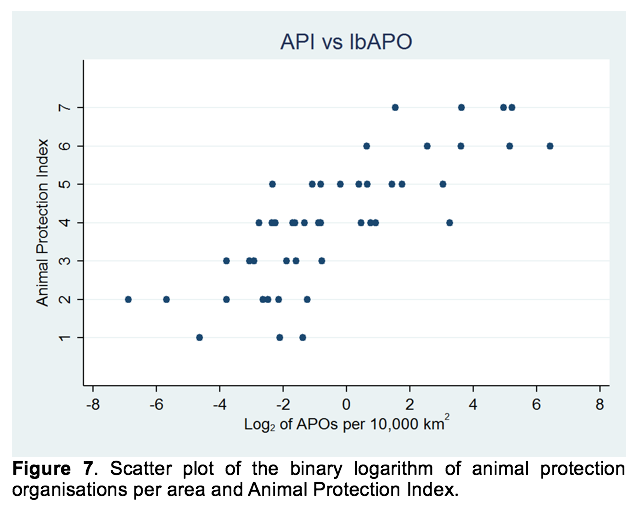
call it lbAPO: ![]()
Figure 7 shows a scatter plot of API and lbAPO. We will see that choosing the binary logarithm will make the interpretation of our statistical results more intuitive.
In two countries from our sample, Myanmar and Niger, there are no APOs registered. When log-transforming the number of APOs per area, both countries are subsequently excluded from our analysis because one cannot log-transform a zero value. For the remaining 48 countries, summary statistics for all variables are shown in Table 2. To sum up, our data set contains cross-sectional data for 48 countries (Table 2). Our dependent variable API is ordinal, consisting of seven categories (A, B, C, D, E, F, G) which have a natural ordering from highest (A) to lowest (G) level of protection.
|
Table 2. Descriptive statistics of variables |
||||||
|
Variable |
N |
Mean |
Median |
SD |
Min |
Max |
|
API |
48 |
4.04 |
4 |
1.64 |
1 |
7 |
|
GDP (per capita, in 1,000 USD) |
48 |
22.9 |
18.1 |
15.3 |
1.5 |
56.8 |
|
PLT |
48 |
5.6 |
9 |
5.9 |
-7 |
10 |
|
CIV |
48 |
54.3 |
52.2 |
5.7 |
42.8 |
67.9 |
|
lbAPO (log2 of APOs/10,000km2) |
48 |
- 0.39 |
- 0.87 |
2.98 |
- 6.90 |
6.43 |
Because our dependent variable API is ordinal, with potentially uneven distances between categories, we cannot use linear regression models, like Ordinary Least Squares, which require the dependent variable to be continuous and unbound. Instead, we use ordered logistic regression to estimate the effect of our independent variables on our dependent variable (Agresti, 1996; Long, 1997).
Ordered logistic regression (also called ordinal logit regression) is similar to binary logistic regression. The latter allows for a dependent variable with only two categories.
In linear regression models, dependent and independent variables are linked by a linear function. In logistic regression models, this link function is called logit. If the dependent variable is binary, i.e. has only two categories 0 and 1, the logit can be interpreted as the natural logarithm of the odds of being in category 1 compared to category 0. The odds are the proportion between the probability for being in category 1 (p) and the probability for being in category 0 (1-p). For each combination of values of independent variables there is a certain probability of falling into one of the two categories.

In logistic regression models, regression coefficients represent the effect a one-unit increase of the independent variable has on the logarithmic odds of being in category 1, holding all other variables constant. The effect on the odds can be expressed as an odds ratio, i.e. the ratio of the odds after and before the one-unit increase. If an odds ratio is larger than one, a one-unit increase in the independent variable increases the odds of falling into category 1. If an odds ratio is exactly one, the odds do not change. If an odds ratio is smaller than one, a one-unit increase in the independent variable decreases the odds of falling into category 1.
Ordered logistic regression models are based on the principles of binary logistic regression. This allows for a dependent variable with multiple categories which have a meaningful order, like the API. Odds are calculated based on cumulative probabilities for each category. With multiple response categories, a regression coefficient of an independent variable represents the effect of a one-unit increase on the odds of falling into or above a higher response category. For our model, we assume proportional odds, i.e. that the effect of the independent variable change on the odds is constant across response categories.
We run an ordered logistic regression with API as dependent variable, and GDP, PLT, CIV, and lbAPO as independent variables. We call this configuration of variables our base model. Table 3 shows these results. Here, we report both the regression coefficients β and the odds ratios. In subsequent tables we will only refer to odds ratios. Recall that for a one-unit increase in the independent variable, the relation between β and odds ratio is:
![]()
|
Table 3. Results from Ordered Logistic Regression with API as dependent variable, base model |
||
|
|
Base Model |
|
|
|
β |
Odds Ratio |
|
GDP |
-0.052 (0.055) |
-0.95 (0.05) |
|
PLT |
-0.367*** (0.096) |
-1.44*** (0.14) |
|
CIV |
-0.151 (0.149) |
-1.16 (0.17) |
|
lbAPO |
-0.645*** (0.169) |
-1.91*** (0.32) |
|
LR chi-square |
69.23*** |
|
|
ρ2 |
0.39 |
|
|
N |
48 |
|
|
Standard errors in parenthesis * p < 0.1; ** p < 0.05; *** p < 0.01 (two-tailed) Likelihood ratio chi-square test with 4 degrees of freedom McFadden's ρ2 (pseudo R2) |
||
Of our four independent variables, only the estimated coefficients of PLT and lbAPO are significant at the 1% level. Estimated coefficients of GDP and CIV are not significant at any common significance level.
The likelihood ratio chi-square test statistic is significant at the 1% level, indicating that at least one coefficient of our independent variables is different from zero. McFadden's ρ2 is an indicator of the model's predictive power, intended to mimic the R2 goodness-of-fit measure from linear regression models, which is why it is sometimes called pseudo R2 (McFadden, 1973). It compares the predictive power of the current model over a model without any independent variable (constant-only model). However, the utility of ρ2 is contested, especially with regard to its absolute value. A value between 0.2 and 0.4 is considered to indicate a good model fit (Louviere, Hensher, & Swait, 2000). In the following, we will use ρ2 primarily to compare predictive powers between different nested models.
In our base model only two out of four independent variables show
significant estimated odds ratios. Table 4 shows results from our base model
compared to three other models, in which GDP and CIV are excluded in turn.
|
Table 4. Results from ordered logistic regression with API as dependent variable |
||||
|
|
Base Model |
Model_2 |
Model_3 |
Slim Model |
|
GDP |
-0.95 (0.05) |
-1.00 (0.03) |
|
- |
|
PLT |
-1.44*** (0.14) |
-1.45*** (0.14) |
-1.42*** (0.13) |
-1.44*** (0.13) |
|
CIV |
-1.16 (0.17) |
|
-1.03 (0.08) |
|
|
lbAPO |
-1.91*** (0.32) |
-1.94*** (0.33) |
-1.87*** (0.31) |
-1.92*** (0.29) |
|
LR chi-square |
69.23*** |
68.19*** |
68.34*** |
68.17*** |
|
ρ2 |
0.39 |
0.39 |
0.39 |
0.39 |
|
N |
48 |
48 |
48 |
48 |
|
Odds ratios are shown for independent variables Standard errors in parenthesis * p < 0.1; ** p < 0.05; *** p < 0.01 |
||||
In none of the four nested models are the estimated odds ratios of GDP or CIV significant at the 10% level. In contrast, estimated odds ratios of both PLT and lbAPO are significant at the 1% level in all models. Both the likelihood ratio chi-square test and McFadden's ρ2 barely vary across all four models. When excluding both GDP and CIV in our slim model ρ2 stays the same. Including these two variables does not add to the predictive power of our model.
The estimated odds ratios of PLT and lbAPO are similar across models. In the base model we estimate that a one-unit increase in PLT increases the odds of a country being in a higher API category by 44%, holding other variables constant. A one-unit increase in lbAPO is estimated to increase the odds of being in a higher API category by 91%, holding other variables constant. Recall that lbAPO is the binary logarithm of the number of animal protection organizations per area. The binary logarithm of a specific APO value is the power to which the number 2 must be raised to get that APO value. Thus, a one-unit increase in lbAPO equals a doubling of APO. Assuming that country areas stay constant we can interpret the odds ratio of lbAPO as follows: Doubling the number of animal protection organizations in a country is estimated to increase the odds of being in a higher API category by 91% (slim model), holding PLT constant.
Our model predicts that a country with a PLT of -10 (fully autocratic) has a probability of 33% to fall into the lowest API category G, and a probability of 56% of falling into the second lowest category F. The cumulative probability of falling into category F or lower is 89%, the sum of those two probabilities, assuming lbAPO is constant at its mean.
To check if we misspecified the model, either by choosing the wrong link function or choosing the wrong set of independent variables, we apply a link test, which simply runs an ordered logistic regression with the initially predicted values and their squares as independent variables and API as dependent variable. With API as dependent variable, both our base model and slim model pass the link test, not indicating that our model is misspecified. We also checked if the proportional-odds assumption is violated. Results from the approximate likelihood ratio test (Wolfe & Gould, 1998) do not indicate that the proportional-odds assumption is violated in any of our models.
If some of our independent variables are strongly correlated with each other, this can lead to inflated standard errors and influence our judgments about the significance of estimated coefficients. As a first step to detect potential multi-collinearity we look at the correlation coefficients between independent variables. A simple correlation matrix is shown in Table 5.
|
Table 5. Correlation coefficients of independent variables |
||||
|
|
GDP |
PLT |
CIV |
lbAPO |
|
GDP |
1.00 |
|
|
|
|
PLT |
0.53 |
1.00 |
|
|
|
CIV |
0.93 |
0.58 |
1.00 |
|
|
lbAPO |
0.72 |
0.57 |
0.74 |
1.00 |
The high correlation coefficient value (0.93) between GDP and CIV gives cause for concern. To further check for multi-collinearity we calculate the variance inflation factors (VIF), reported in Table 6 for different model configurations. VIF is an indicator of the extent to which multi-collinearity is causing standard errors to inflate. There are different rules of thumb on which VIF value is acceptable in the statistical literature, ranging at least from 4 to 30 (O'Brien, 2007). To see if multi-collinearity markedly influenced our regression results, we can drop GDP or CIV from the model. Recall that we did this already to check if estimated coefficients of GDP and CIV stay insignificant when doing our analysis in the previous section, with the results that with either of the two variables excluded (Table 4, Model_2 and Model_3), the standard error of the remaining variable is lower, but estimated coefficients remain insignificant.
In our slim model the correlation matrix and VIF do not suggest multi-collinearity between PLT and lbAPO. We can conclude that our analysis is not markedly limited by multi-collinearity.
|
Table 6. Variance Inflation Factors (VIF) of independent variables in different model configurations |
||||
|
|
Base Model |
Model_2 |
Model_3 |
Slim Model |
|
GDP |
8.12 |
2.19 |
|
|
|
PLT |
1.65 |
1.55 |
1.63 |
1.48 |
|
CIV |
9.02 |
|
2.44 |
|
|
lbAPO |
2.43 |
2.35 |
2.37 |
1.48 |
Based on the results of our statistical analysis we can draw mixed conclusions about our hypotheses formulated in the previous section.
With regard to our first hypothesis, we fail to show that economic development, as indicated by GDP per capita, is a determinant of animal protection policy when controlling for level of democracy and civil society strength. A country's odds of having stricter animal protection policies are not significantly affected by its per capita income.
The second hypothesis is supported by our analysis. Increasing a country's level of democracy, as indicated by the Polity Score, increases its odds of having stricter animal protection policies.
The third hypothesis concerned civil society. Here the results are mixed. We fail to show that broad public political engagement, as indicated by the Civic Activism Index, is related to animal protection policies. However, for the presence of civil society organizations more narrowly focused on animal protection, our results do suggest a significant relationship. A larger number of animal protection organizations in a country is associated with higher odds of having stricter animal protection policies.
We have to be cautious when we compare the extent of influence between level of democracy and the number of animal protection organizations. For one, our log-transformed APO variable indicates a marginal diminishing effect on animal protection policy. Such an effect is not found for the Polity Score (log-transforming the Polity Score does not increase the predictive power of our model).
Also, while increasing the level of democracy is related to stricter animal protection policies, the measure we applied in our analysis suggests that there is a ceiling. A country cannot become infinitely more democratic. The Polity Score has a maximum value of 10, indicating fully democratic institutional characteristics and absence of autocratic institutional characteristics. This ceiling is not just hypothetical. Seventeen countries, more than a third of the countries in our study, exhibit this highest level of democracy. In contrast, the number of animal protection organizations in a country is, at least hypothetically, not limited upwards.
Does our analysis suggest that neither economic development nor broad civil society have any influence on animal protection policies? Not necessarily. Although we found no significant association between these two variables with animal protection policies when accounting for level of democracy and number of animal protection organizations, there are other reasons why we might have failed to detect such effects with our model. For instance, GDP per capita might not capture the true effect of economic development on animal protection policies. One of our reasons for including economic development as an explanatory variable, following Frank (2008), was the suggestion that animal protection policy could be seen as a "luxury good", for which public demand is higher in affluent countries where more basic demands for life satisfaction are met. In a country with large GDP but high income inequality, a sizeable part of the population may struggle to meet such basic demands for life satisfaction, which would diminish overall public demand for stricter animal protection policy. GDP per capita, though, measures only overall economic output not income inequality, and thus may not adequately reflect the effect of public demand for policies.
In addition to such conceptual limitations, there is evidence suggesting that maximum likelihood estimation techniques, such as the ordered logistic regression model we used, with more than two independent variables and a small N similar to ours, are prone to making Type II errors. A Type II error occurs when one fails to reject the null hypothesis although the null hypothesis is false (Hart & Clark, 1999). In our case this implies that our analysis might have missed a significant relationship between GDP per capita, CIV, and API. We thus should be extremely cautious in dismissing those two dependent variables.
To account for civil society strength with specific regard to animal protection, we chose as variable the number of animal protection organizations per country area. There are several potential issues with this variable choice.
Activities of animal protection organizations are diverse and include, among others, political advocacy, public awareness raising, provision of animal shelters, promotion of vegetarian and vegan diets, and conservation of natural habitats. Arguably, the impact of different activities on public policy varies widely. For example, it seems plausible that a political advocacy group which dedicates all its efforts on lobbying for stricter animal protection legislation has more influence on policy outputs than an organization maintaining shelters for abandoned pets, everything else being equal. But in our data we do not distinguish between them, which could bias our results.
A similar challenge concerns the extent to which an organization focuses its work on animal protection. With our APO variable we do not differentiate between an organization solely committed to animal protection, and one for which animal protection is just a peripheral goal. Examples of two such different organizations included in the WorldAnimalNet directory are PETA (People for the Ethical Treatment of Animals), which exclusively works on animal protection, and WWF (World Wide Fund for Nature), which identifies animal protection as part of their broader efforts on issues like climate change, nature conservation, and sustainability. In addition, with our data we fail to account for differences between organizations' financial resources, staff, and membership.
Future research on policy impacts of animal protection organizations would benefit from distinguishing between organizations' activities, issue focus, and resources. This could be done by categorizing organizations from the WorldAnimalNet directory accordingly. With our goal to include as many countries as possible, this was beyond the scope of our study.
While we did not make any organization-based adjustment to the number of animal protection organizations, we did adjust for countries' area size. This adjustment was motivated by the fact that our raw data from the WorldAnimalNet directory counts each office location of even the same organization separately, thus inflating total numbers in larger sized countries. We already mentioned that this effect—more locations in larger countries—is arguably more pronounced for some organizations than for others. For animal shelter organizations, for example, it makes more sense to maintain multiple locations in order to provide their services in different cities and regions. The same cannot necessarily be said for an organization lobbying for national legislation. In light of this, our adjustment for country area is likely to bias our results depending on the distribution of organization types within countries. Another complication is that the assumed effect of different area size is unlikely to be linear.
Notwithstanding such conceptual and methodological limitations of our study, there are some broad conclusions to be drawn. For actors who seek to increase the level of animal protection provided by government policies, our study has some broad implications. The very plain conclusion that the activity of animal protection organizations does seem to make a difference for government policy is worth noting. The fact that countries included in our analysis almost all have large livestock industries indicates that civil society can impact policy even if opposed by considerable business interests (assuming that stricter animal protection policies are by and large opposed by producers of animal products).
International actors, such as activist groups or organizations seeking to provide funding for national advocacy groups, might increase their impact on policy if they direct their efforts towards more democratic countries. Assuming that in the short and medium term, a single organization probably cannot significantly change a country's regime characteristics, it is reasonable to focus on strengthening civil society activity on the issue of animal protection if one wants to influence policies. However, our analysis suggests that increasing civil society activity has diminishing marginal impacts. Thus, targeting countries with strong democratic institutions but a relatively underdeveloped civil society sector with regard to animal protection seems to be a promising approach. The present state of policy strictness should of course also be taken into consideration, with a focus on countries where there is large room for improvement. Some countries included in our analysis which fit that description are Turkey, India, and Peru. Turkey's Animal Protection Index stands at E, the third lowest out of seven categories. Its Polity Score of 9 indicates strong democratic institutions. Yet with only 21 animal protection organizations, Turkey ranks in the bottom third of our country group for narrow civil society strength.
Improving and expanding the Animal Protection Index can increase its utility for future research. A more transparent methodology would enable scrutiny and improvements. Capturing the actual implementation and enforcement component of existing policies would give a more complete picture of policy strictness and help assess effectiveness of policies beyond mere commitment. Of course this would still fall short of measuring actual outcomes with regard to animal well-being. For that purpose, animal based indicators are needed.
Apart from this wish list, researchers can use the API in its current iteration to analyze policies specific to certain types of animal use. With sub-indicators from the API as dependent variables, analysis of policy outputs with a specific focus on different types of animals, e.g. farm animals, is possible. In many countries, animal protection is usually not one unified piece in a government policy portfolio, but rather is divided among different departments and by the different purposes animals are used for, e.g. in Germany the Ministry of Agriculture is responsible for farm animals, and the Ministry of Research for animals used for scientific experiments. Research by Frank (2008) hinted in the direction that the effects of economic development on animal well-being are markedly different for farm animals and companion animals.
When economic development serves as a proxy for unobserved variables such as satisfaction of basic needs or administrative capacity, care should be taken to use an economic indicator that reflects the unobserved variables as accurately as possible. When feasible, direct measurement of the variable of interest is preferred. For cross-country studies, such as ours, multi-country surveys would greatly increase the evidence base for assessing the impact of public opinion, attitudes, and issue salience on animal protection policies. The World Values Survey sporadically included questions related to animals in past surveys. Regular inclusion in repeated waves covering different countries would both improve the base data for cross-section analysis, and enable time series and panel data analysis.
Parsing our other independent variables can also be a beneficial approach. Organizations registered in the WorldAnimalNet directory could be categorized by their primary activity (e.g. education, political advocacy), resources (e.g. number of national staff, funding), and issue focus. Variables not included in our analysis are also worth exploring. Institutional factors other than political regime-type might play a role, for example different regulatory models of the relationship between governments and industries (e.g. consensual versus adversarial).
Animal protection policy remains an under-explored field and there are several promising directions, some of which we have sketched here, that future research can explore. With this study we hope to have contributed to broadening the basis for such research.
Agresti, A. (1996). An introduction to categorical data analysis (Vol. 135). New York: Wiley.
Caviglia-Harris, J. L., Chambers, D., & Kahn, J. R. (2009). Taking the "U" out of Kuznets: A comprehensive analysis of the EKC and environmental degradation. Ecological Economics, 68(4), 1149-1159. http://dx.doi.org/10.1016/j.ecolecon.2008.08.006
Chemnitz, C. & Becheva, S. (Eds.). (2014). Meat atlas: Facts and figures about the animals we eat. Berlin: Heinrich Böll Foundation; Brussels: Friends of the Earth Europe.
Dietz, T., Fitzgerald, A., & Shwom, R. (2005). Environmental values. Annual Review of Environment and Resources, 30(1), 335-372. http://dx.doi.org/10.1146/annurev.energy.30.050504.144444
FAO (2013). Statistical Yearbook 2013: World Food and Agriculture. Rome: Food and Agriculture Organization of the United Nations.
Fearon, J. D., & Laitin, D. D. (2003). Ethnicity, insurgency, and civil war. American Political Science Review, 97(1), 75-90. http://dx.doi.org/10.1017/S0003055403000534
Fiorino, D. (2011). Explaining national environmental performance: approaches, evidence, and implications. Policy Sciences, 44(4), 367-389. http://dx.doi.org/10.1007/s11077-011-9140-8
Frank, J. (2008). Is there an "animal welfare Kuznets curve?" Ecological Economics, 66(2-3), 478-491. http://dx.doi.org/10.1016/j.ecolecon.2007.10.017
Fraser, D. (2008). Toward a global perspective on farm animal welfare. Applied Animal Behaviour Science, 113(4), 330-339. http://dx.doi.org/10.1016/j.applanim.2008.01.011
Gallup, G. G. (1970). Chimpanzees: self-recognition. Science, 167(3914), 86-87.
Gill, M., Smith, P., & Wilkinson, J. (2010). Mitigating climate change: the role of domestic livestock. Animal, 4(3), 323-333.
Hart, R. A., & Clark, D. H. (1999). Does size matter? Exploring the small sample properties of maximum likelihood estimation. Paper presented at the Annual Meeting of the Midwest Political Science Association.
IMF. (2014). World Economic Outlook Database. Retrieved 06/06/2015 from: https://www.imf.org/external/pubs/ft/weo/2014/02/weodata/index.aspx
Irwin, P. G. (2003). A strategic review of international animal protection. In D. J. Salem & A. N. Rowan (Eds.), The state of the animals 2003 (pp. 1-8). Washington, DC: Humane Society Press.
ISD. (2013). Indices of Social Development. Retrieved 07/06/2015 from: http://www.IndSocDev.org/
Jones, R. C. (2013). Science, sentience, and animal welfare. Biology & Philosophy, 28(1), 1-30. http://dx.doi.org/10.1007/s10539-012-9351-1
Kuznets, S. (1955). Economic growth and income inequality. The American Economic Review, 45(1), 1-28.
Li, Q., & Reuveny, R. (2006). Democracy and environmental degradation. International Studies Quarterly, 50(4), 935-956. http://dx.doi.org/10.1111/j.1468-2478.2006.00432.x
Lombardini, C., Kosenius, A.-K., Kulmala, S., & Lindroos, M. (2011). Is there a Finnish Animal Welfare Kuznets Curve? Paper presented at the EAAE 2011 Congress: Change and Uncertainty, Zurich.
Long, J. S. (1997). Regression models for categorical and limited dependent variables. Thousand Oaks, CA: Sage.
Louviere, J. J., Hensher, D. A., & Swait, J. D. (2000). Stated choice methods: Analysis and applications. Cambridge: Cambridge University Press.
Marshall, M. G., & Jaggers, K. (2014). Polity IV Project, Political Regime Characteristics and Transitions, 1800-2014. Retrieved 09/06/2015 from: http://www.systemicpeace.org/inscrdata.html
McFadden, D. (1973). Conditional logit analysis of qualitative choice behavior. In P. Zarembka (Ed.), Frontiers in Econometrics (pp. 105-142). New York: Academic Press.
Morris, M. C. (2013). Improved nonhuman animal welfare is related more to income equality than it is to income. Journal of Applied Animal Welfare Science, 16(3), 272-293. http://dx.doi.org/10.1080/10888705.2013.768921
O'Brien, R. M. (2007). A caution regarding rules of thumb for variance inflation factors. Quality & Quantity, 41(5), 673-690. http://dx.doi.org/10.1007/s11135-006-9018-6
Proctor, H. (2012). Animal sentience: Where are we and where are we heading? Animals, 2(4), 628-639.
Regan, T. (1983). The case for animal rights. Berkeley, CA: University of California Press.
Rowan, A. N., & Rosen, B. (2005). Progress in animal legislation: measurement and assessment. In D. J. Salem & A. N. Rowan (Eds.), The state of the animals 2005 (pp. 79-94). Washington, DC: Humane Society Press.
Singer, P. (1975). Animal liberation: a new ethics for our treatment of animals. New York: New York Review.
Stern, D. I. (2004). The rise and fall of the Environmental Kuznets Curve. World Development, 32(8), 1419-1439. http://dx.doi.org/10.1016/j.worlddev.2004.03.004
Taylor, K., Gordon, N., Langley, G., & Higgins, W. (2008). Estimate for worldwide laboratory animal use in 2005. Alternatives to Laboratory Animals, 36(3), 327-342.
Trent, N., Edwards, S., Felt, J., & O'Meara, K. (2005). International animal law, with a concentration on Latin America, Asia, and Africa. In D. J. Salem & A. N. Rowan (Eds.), The state of the animals 2005 (pp. 65-77). Washington, DC: Humane Society Press.
WAP. (2014). Animal Protection Index. Retrieved 21/05/2015, from http://api.worldanimalprotection.org/
Wolfe, R., & Gould, W. (1998). An approximate likelihood-ratio test for ordinal response models. Stata Technical Bulletin, 7(42).
WorldAnimalNet. (2015). WAN Directory. Retrieved 26/05/2015 http://worldanimal.net/directory/
Yandle, B., Bhattarai, M., & Vijayaraghavan, M. (2004). Environmental Kuznets curves: a review of findings, methods, and policy implications. Property and Environment Research Center.